 |
ADTF Qt5
|
|
ADTF Qt5
|
The ADTF Status Monitor connects to an ADTF instance and displays the resource and kernel information.
It extracts some information like CPU and Memory consumption from a running ADTF Session and displays it.
The information is retrieved by connecting to the running ADTF Session using RPC.
The information is updated repeatedly using a defined update intervall.
You can either start the ADTF Session to connect to before or after starting the Status Monitor.
For any purpose, please execute the adtf_statusmonitor with the option --help, which will give you an overview and example usage of available options and commands.
It can be executed standalone or from the ADTF Configuration Editor, when the .adtfenvironment file from this ADTF Qt5 package is loaded.
Furthermore it can also be launched from within ADTF Control with the help of the statusmonitor command.
To show information about a running Session just start the ADTF Status Monitor.
If the argument --url is not provided the default URL http://localhost:8000 will be used.
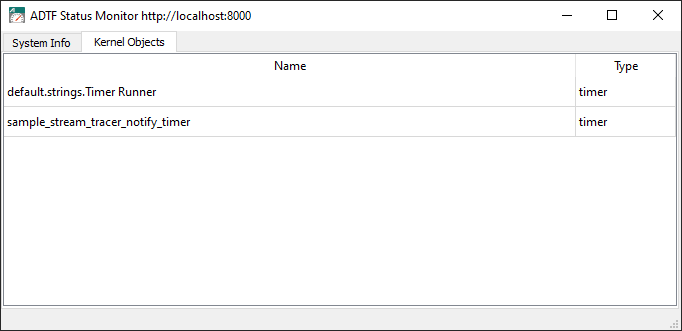
The image shows the first tab System Info.
To get more detailed information about the shown information hover over the first column containing the infos name (e.g. CPU).
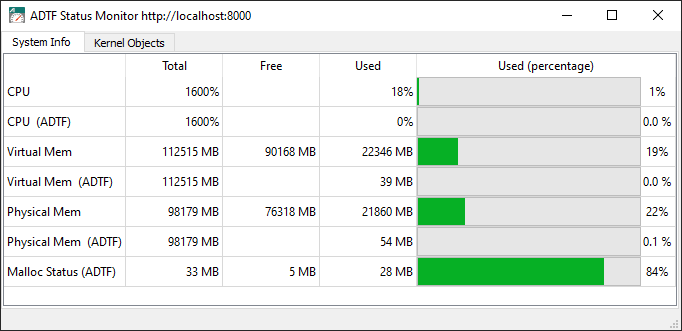
In the following image the tab kernel objects is displayed.
It shows a list of all used kernel objects within the connected ADTF Session.
Kernel objects are threads or timer.